Do we really need “Debugger Customization”?

Application debugging is one of the most interesting part in a software development cycle. At the same time it faces some difficulties, Microsoft has already provided a couple of good features to overcome these problems and it helps developer to experience a smooth debugging session. Visual Studio provides a number of good features like Immediate Window, Command Window, Call-stack, Local, Auto and many more, which highly evolves on increasing developers productivity. Debugging an application is not an easy job. As it require good knowledge in debugging tools available in Visual Studio. So i have always been eager to learn new techniques to  make it as easy as possible.

Recently i got a chance to learn some tricks over debugger which i am sharing here!

Debugger1
2.1.1

In 2.1.1, moving mouse over debugger variable shows the debugger value as variable type. There is way to start take control over debugger is by overriding “ToString()” method.
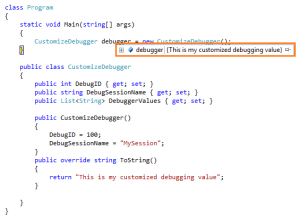
Debugger2
2.1.2

Now in 2.1.2 the debugger use “ToString()” method as the default value for debugger variable. Another nice option we have is to use the “DebuggerDisplay” attribute which will give more control over the debugging variable.
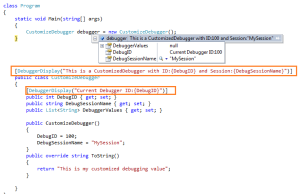
Debugger3
2.1.3

The “DebuggerDisplay” attribute accepts a string where we can refer class members as arguments. In debugging mode these members replaces the string arguments. It gives more clarity while debugging the code and is useful when member names are defined in a complex way. We can use the “DebuggerDisplay” attribute with the Class, Structs, Delegates, Enums, Fields, Properties, Assemblies.

Visual studio exposes one more attribute called “DebuggerBrowsable”.

Debugger3
2.1.4

The “DebuggerBrowsableState.Never” attribute can apply only to members and fields which should not visible on debug mode. For collection we can use “DebuggerBrowsableState.RootHidden” which automatically expand the collection while debugging and thus provide more readability.
Remote Debugging in Visual Studio – Part 2

In my previous post i have explained about How to debug an application using Visual Studio Debugger. There is one more way to debug your remote application using a tool called “msvsmon.exe”. The Remote Debugging Monitor (msvsmon.exe) is a small application that Visual Studio connects to for remote debugging and can be found in the location of %Program Files%\Microsoft Visual Studio 11.0\Common7\IDE\Remote Debugger. Remote Debugging involves two way communication between the Visual Studio Debugger and Visual Studio Remote Debugging Monitor(msvsmon.exe). For remote debugging to work, it is important which user runs Visual Studio and also which user runs msvsmon.exe.  To connect to msvsmon, you must run Visual Studio under the same user account as msvsmon. So  you must have a local user account on each computer, and both accounts must have the same user name and password. I have a simple HelloWorld.exe application on my remote machine. To start remote debugging

  • Copy all pdb files on remote machine and launch your application there.
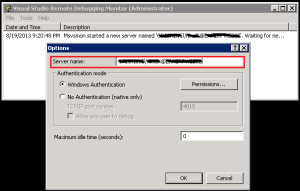
  • Run msvsmon.exe tool on Remote machine by using visual studio command prompt or launch directly from the location.

msvsmonServerName

  • Copy Server name from msvsmon.exe
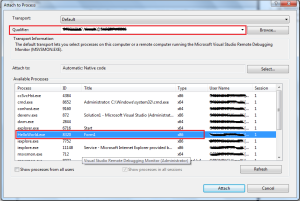
  • Open application source code in client machine and launch “Attach To Process” window (CNTRL + ALT + P)
  • Paste server name in “Qualifier” textbox and Refresh will shows all the process from Remote machine
  • Attach the HelloWorld.exe project to debug.

Attach We have option to share pdb files from client side. Follow the below steps to debug your application using shared pdb files. Client machine

  • Create a folder with all pdb files that you want to debug.
  • Share the folder to access everyone.

Server Side

  • Open Command Prompt.
  • Change directory to msvsmon.exe location.
  • Set Symbol Path for msvsmon.exe using “set _NT_SYMBOL_PATH command and launch msvsmon.exe

SymbolShare

Next time onwards visual studio will try to  load symbols from shared path also.